- This post expresses a bullish view on Bank of Internet (BOFI)
- BOFI is a well-run bank trading at a low valuation that should continue to grow earnings and/or tangible book value for the foreseeable future
- While its earnings growth will slow in 2010, and earnings could contract when the yield curve flattens, the current valuation is still too low given the company’s near-term and long-term growth prospects
- The PDF materials referenced in this post can be downloaded here [1]
This week, I’m writing a bullish post on BOFI Holding Inc., which trades as BOFI on NASDAQ and is the holding company for Bank of Internet USA. Bank of Internet is an online bank. It has only 1 physical branch; virtually all deposits are sourced through the internet by offering high-yield accounts; and it originates loans through the internet. I view BOFI as an attractive near-term to intermediate-term investment, and while its long-term prospects remain a bit uncertain, BOFI could turn out to be a top-notch performer over the long-term as well. The long-term concerns center around the viability of the “internet bank” business model, and it’s not so much that I’m bearish on that business model as there lies some uncertainty in exactly how it will evolve. I’ll discuss the pros and cons of an “internet bank” in this post, and outline the conclusion I’ve come to so far.
Accounts managed by Kerrisdale currently hold BOFI, and we may buy or sell shares at any time. We will not disclose our sale if and when we sell, and we will not necessarily disclose that we have changed our thesis if we discover something faulty with our analysis at a later date.
BOFI financials and other data referenced in this post can be downloaded here [1].
Company Description
Bank of Internet is a nationwide savings bank operating primarily over the internet. Its website is www.bankofinternet.com [2]. Using online applications, customers apply for checking accounts, savings accounts, CDs, etc. On the asset side, BOFI originates multifamily (ie. apartments and condos) and single-family mortgages, as well as home equity loans, RV loans and commercial real estate loans. It also purchases loan pools and debt instruments such as mortgage backed securities.
The bank has 1 physical branch in San Diego. It served 27,000 retail deposit and loan customers across all 50 states as of fiscal year-end June 30, 2009. As of 9/30/09, total assets were $1.3bn.
High-Level Financials
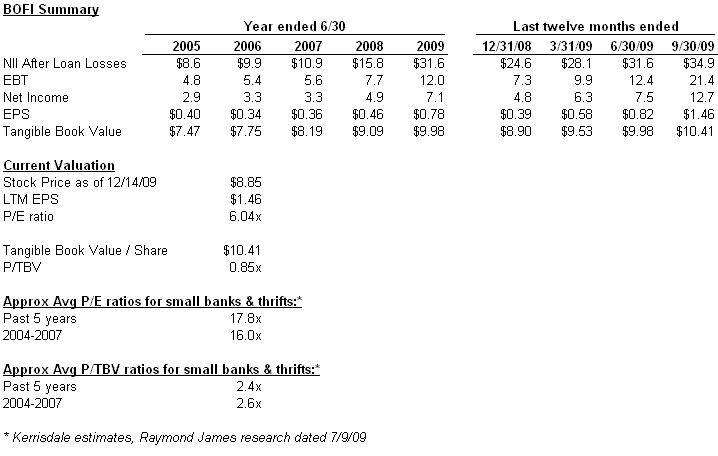
Before discussing the granular drivers of the business, I’m going to summarize the Company’s historical (i) net interest income after loan losses, (ii) EBT, (iii) net income and (iv) earnings per share for the past 5 years, as well as last-twelve-months for the past 4 quarters. I’m also going to note the company’s current P/E and price-to-tangible-book-value ratios, and compare them to the average P/E and P/TBV ratios of US banks over the past 5 years and during 2004-2007, a more orderly period in banking valuations. Here are those stats:
Note there is a slight discrepancy between LTM and FY09 stats due to different quarterly and annual numbers for non-interest expense; it’s not important. For historical banking multiples, I used data from a Raymond James report called “Summer 2009 Industry Overview” from July 9, 2009. It’s an excellent report and I reference it throughout this email.
BOFI’s profitability has been growing fast, and its valuation is very cheap given those historical trends. If an investor can get comfortable that these earnings trends are sustainable, even if at a more moderate pace, this is a cheap bank. My conclusion is that although earnings growth will moderate from the FY2009 growth level, it will continue to be healthy for the foreseeable future. An internet bank may never deserve the same valuation multiple as a healthy Wells Fargo or Bank of America, but 0.9x P/TBV and 6.0x P/E are too low. I think a 1.5x P/TBV or 12x P/E valuation is more appropriate, which implies a $15-$17 stock price, or 50%+ upside from current levels. If the multiple doesn’t rise, continued growth in tangible book value should still generate a steady increase in BOFI’s stock price.
Balance Sheet
Let’s start off by discussing Bank of Internet’s loan book and investment portfolio. BOFI has one of the best-performing loan books of any bank in the entire country, due to conservative underwriting. Its loans are constituted as follows:
Apartment and condo mortgages comprise 52% of all loans, while single family mortgages comprise 26%. As of 9/30/09, total non-performing loans for BOFI constitute 0.77% of total loans; total non-performing assets constitute 0.73% of total assets. For comparison purposes, see page 4 of the attached materials, where I’ve included a chart from Raymond James that lists the non-performing assets ratio for 58 other banks. The median ratio was 2.66% as of 3/31/09. Only 4 banks had lower ratios than BOFI, out of 58.
Another sign of BOFI’s conservative underwriting is the loan-to-value ratios of its loans. The ratio of a loan amount to the value of a property securing the loan is called the loan-to-value ratio or LTV. The following table shows the LTVs of its loan portfolio on weighted average and median bases at June 30, 2009. The LTVs were calculated by dividing (a) the loan principal balance less principal repayments by (b) the appraisal value of the property securing the loan at the time of the funding or, for certain purchased seasoned loans, an adjusted appraised value based upon an independent review at the time of the purchase.
These are low LTVs. BOFI does not release FICO scores, debt-to-income or other detailed statistics for its borrowers, but given their stellar 2008 and 2009 loan performance, I suspect that many of these credit statistics are excellent as well.
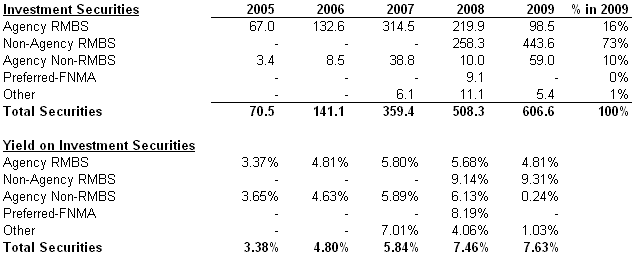
Loans make up 52% of BOFI’s total assets. Investment securities make up another 44%. Here’s a breakdown of their investment securities portfolio:
Non-agency residential mortgage-backed securities have grown from 0% of their investment portfolio in 2007 to 73% as of 6/30/09, and now comprise 36% of total assets. BOFI believes that the trading values of many triple AAA mortgage-backed securities were punished too much by the credit crisis, and that purchasing them at discounts represented one of the best uses of their capital throughout much of 2008 and 2009. I think they’re right. At June 30, 2009, their portfolio of non-agency securities included 113 different RMBS securities of which 101 were rated AAA by at least one rating agency. Substantially all of their non-agency RMBS are super senior tranches protected against realized loss by subordinated tranches.
In turn, their agency securities have declined from 88% of their investment portfolio and 39% of total assets in 2007 to 16% of the investment portfolio and 8% of total assets at 6/30/09. Prior to the credit crisis, BOFI invested heavily in agency securities, preferring government-backed securities to the riskier types of loans being originated in the market. Then during and after the credit crisis, it aggressively plowed into AAA RMBS securities trading at discounts. They were fearful when others were greedy, and greedy when others were fearful. Suffice it to say, there are smart people making asset allocation decisions for BOFI. Their decisions haven’t been mistake-free – the bank’s originations of RV loans in 2007 have accounted for a disproportionate share of their total problem loans. But RV loans are a small part of the portfolio; the bad loans aren’t too problematic; and BOFI has reduced RV lending materially.
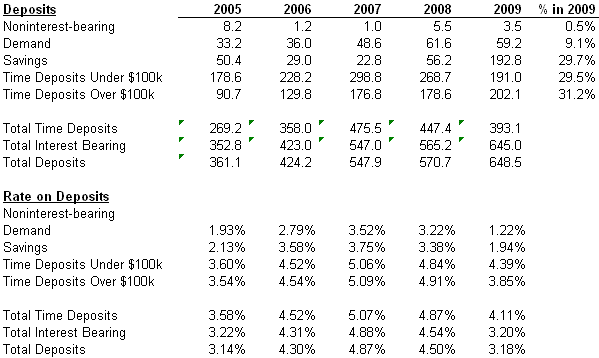
Having discussed the bank’s assets, let’s move to the liabilities side. Deposits comprise 55% of total liabilities, and are broken down below:
A couple things to note.
First, deposits have been growing, up in each of the past 4 years at a CAGR of 16%. Last year, they grew 14%, and they surged 19% quarter-over-quarter for the most recent period. Note that there have been shifts in the “type” of deposits, as BOFI has actively made certain accounts more attractive than others by adjusting interest rates and other terms. For instance, in FY 2009 they made savings accounts more attractive relative to time deposits because they wanted to avoid locking themselves to paying high rates over longer periods given the declining interest rate environment.
Second, the interest rates offered by Bank of Internet are amongst the highest offered by any bank. As an internet bank, Bank of Internet cannot rely on local physical branches and personal customer relationships to drive deposit growth. Rather, it needs to offer very competitive interest rates for depositors who are seeking high yields on their accounts. Check out bankrate.com [8] to see how Bank of Internet offers one of the highest interest rates in the country.
This is one of the main criticisms of the internet bank business model. To attract customers, an internet bank must pay industry-high rates, which will depress its net interest margin. As well, its customers are not sticky. While Wells Fargo customers stay with Wells Fargo for purposes of convenience even if savings account interest rates are low, Bank of Internet customers may flock to other internet banks if BOFI does not offer the highest rate and lowest fees. I somewhat agree with this criticism, and that is why I would pay a higher valuation multiple for a healthy Wells Fargo. But BOFI’s low non-interest cost structure allows it to offer industry-leading high rates and still earn adequate, if not spectacular, returns on equity. These returns are high enough to justify a valuation multiple materially above 0.9x P/TBV. And in the near-term, given the current steep yield curve and BOFI’s intelligent asset allocation, the bank is earning a net interest margin and return on equity comparable with most brick-and-mortar banks.
Before moving away from the balance sheet, it’s important to note that Bank of Internet is well-capitalized.
My median capital ratio of banks is from the Raymond James report dated 7/9/09.
We’ve demonstrated that Bank of Internet has a sound balance sheet, with a high quality loan and investments book. On the liability side, as an internet bank, BOFI has a high cost of funding, but also has been generating high deposit growth. It doesn’t have exposure to any wholesale short-term funding that we should be concerned about.
The current P/TBV multiple of 0.9x doesn’t seem justified after examining BOFI’s balance sheet.
Income Statement
Shifting to the income statement, let’s discuss the building blocks that generate the company’s earnings.
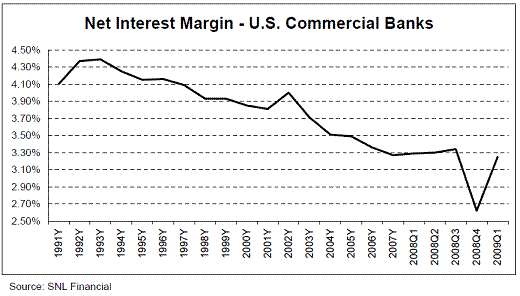
First, as a bank, the company’s main driver of profitability is its net interest margin. That net interest margin surged in 2009, as its opportunistic asset reallocation increased the overall yield on its assets and Fed interest rate cuts reduced its cost of funding. Over the past 8 quarters, its NIM has steadily risen from 1.24% to 3.88%. The current 3.5% to 4.0% level is probably as high as it will go. I think that the NIM should continue to stay there over the near-term, given that I believe that the Fed will continue to keep short-term rates low for at least the next 6 months. Over time, BOFI’s NIM may very well contract, and I think a more appropriate NIM in a normalized environment is around 2%. The NIM hovered in the 1.0%-1.5% range during 2006 and 2007, but that was during a particularly flat yield curve. Its current 3.5%-4.0% range is occurring during a particularly steep yield curve. In a more normalized yield curve environment, an estimate of 2.0% seems reasonable. This margin is lower than that of a typical bank, which achieves NIMs closer to 3% to 4% in a more normalized environment. Below are historical NIMs from Raymond James:
It’s fair to assume that BOFI may achieve NIMs 100bps to 200bps below a typical bank in normal times. Its current NIM of 3.88% is actually higher than the 3.19% median NIM in 3/31/09 that Raymond James had for its 58-bank coverage universe (see page 5). But these are special times, and BOFI will not always have the luxury of piling into AAA RMBS at meaningful discounts while competitors are struggling with problem loans.
BOFI can partly make up for its lower NIMs by having lower non-interest expenses. Its lack of physical locations allows it to have proportionally lower salary, rent and other non-interest expenses, when compared to non-internet banks. The key metric to watch is its “Efficiency Ratio”, which is calculated in different ways by different banks, but which we’ll calculate as non-interest expense divided by the sum of net interest income + noninterest income.
For a typical bank, the effiency ratio hovers around 55% to 60%. For BOFI, that number shrunk to 28.4% in the quarter ended 9/30/09. It has been helped by the bank’s high NIM, but even when the NIM normalizes, BOFI should still have industry-leading efficiency ratios, and even moreso as the bank grows. The bank’s branchless cost structure is very scaleable. I show efficiency ratios of other banks on page 6 of the attached materials. Only one bank on that list has a lower efficiency ratio.
Next, let’s discuss non-interest income. Non-interest income includes a variety of items, including service charges, mortgage banking fees, gains-on-sale, trust fees, etc. BOFI should tend to have industry-low non-interest income. BOFI doesn’t attract business customers easily, given that business customers have more complicated banking needs than a depositor simply looking for a high-yielding savings account. As well, because an internet bank is a pricetaker generally, it can’t get away with the sort of hidden fees that physical banks like Wells Fargo or Bank of America charge regularly. Over the past three years, BOFI’s noninterest income, as a percentage of the sum of net interest income and noninterest income, has been under 10%. In contrast, the number for the average commercial bank is typically around 40%, though for the Raymond James universe, that number is more like 25% (regional banks will have materially lower noninterest income than larger commercial banks like JP Morgan Chase, etc.).
Let’s also discuss loan losses. As we showed in the balance sheet section, BOFI has a strong loan book. Its loan loss provisions have been 15% to 20% of revenue in FY09 and over the past several quarters. In comparison, other banks have averaged loan loss provisions in the 30% to 50% range. BOFI’s loan loss reserves are low relative to other banks – its reserve was at 0.87% in the most recent quarter, compared to a median of 1.64% for the 58 banks in the Raymond James universe. But then again, we should expect to see materially less losses at BOFI compared with other banks. Indeed, BOFI’s loan loss reserve divided by nonperforming loans was at 115% as of 9/30/09. For the banks in the Raymond James universe, the median number was a lower 75% as of the quarter ended 3/31/09.
Last, I want to discuss deposit growth, which is an influential factor in overall growth. Deposit growth is fairly stagnant for most banks, and by my estimates, deposit growth may approximate 5% to 10% a year for the typical bank. For BOFI, deposit growth has been higher historically, and should continue to be in the future. As we discussed earlier, BOFI’s deposit growth CAGR has been 16% over the past 4 years. Intuitively, this makes sense. The typical community bank may have a sticky customer base, but it should have a difficult time growing that customer base. Community banking is a mature sector. Online savings accounts, however, are a new phenomenon, and as customers become more comfortable managing their finances over the internet, depositors will increasingly shift funds from local banks to online accounts offering higher interest rates. BOFI has also embarked on initiatives to accelerate this trend, such as teaming up with independent financial advisers to provide attractive banking options to customers. These advisers want to avoid referring their customers to brick-and-mortar banks that have captive wealth management groups.
As we’ve seen from this section, BOFI, and internet banks in general, are banks of extremes. On the negative side, in a normalized environment, they should have among the lowest NIMs and non-interest income ratios. On the plus side, they should have among the highest deposit growth and lowest efficiency ratios.
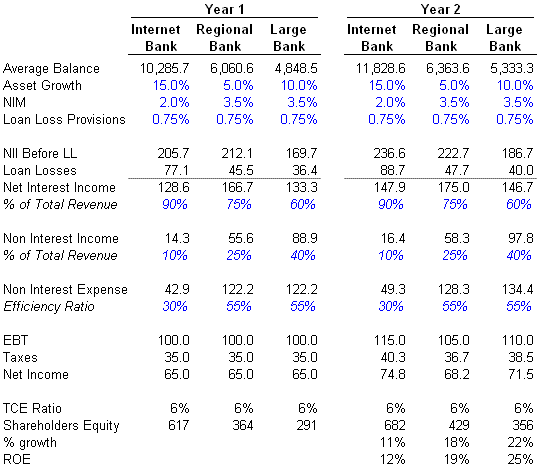
So overall, is it preferable to be an internet bank or a brick-and-mortar bank? Which should command a higher multiple? Well, let’s assume that we have three banks with comparable loan books and EBT of $100. One is an internet bank, another a regional bank and the third a large bank. Based on some of the discussion above, I’ve made various assumptions for deposit growth, NIM, efficiency ratio, etc. Let’s see which grows faster:
Based on this analysis, the internet bank grows its earnings faster, but has a lower return on equity. Should it get the higher multiple? I’ll be perfectly honest – I don’t quite understand why I’m seeing higher earnings growth and lower return on equity. There’s some corporate finance math that’s eluding me. I’m tempted to say that the internet bank’s low efficiency ratio and higher deposit growth makes up for the lower NIM and Noninterest Income, assuming it can achieve the requisite 15% deposit growth and 2% NIM. But I don’t have a totally firm grasp on how to interpret the numbers in terms of which business model should receive a higher valuation.
No matter. We’re not trying to be professors here. Our real concern is whether Bank of Internet should trade above 0.9x P/TBV and 6.0x P/E, and the question of which business model should trade at a premium is secondary.
The key point is that if our internet bank can achieve returns on equity greater than 10% for the foreseeable future, it deserves a higher valuation than its current one.
Final Thoughts on the Internet Bank Business Model
The bull case for an online bank is that the internet is making retail banking increasingly commoditized. Twenty years ago, a customer had a handful of neighborhood banks to choose from to store his deposits. Today, that customer can choose a neighborhood bank, or can choose an online account from either on online bank like Everbank or Bank of Internet or from an online account offering from a large multiservice bank (ie. ING Direct, HSBC Direct, Ally Bank, etc.) As consumers become more accustomed to making financial transactions over the internet, online accounts will continue to gain increasing market share. There’s no disputing that fact. But who will be the winners and losers from this trend?
Online banking faces many of the same questions as online retailing. Is Amazon.com’s current growth sustainable, or will Walmart and Target use their name recognition over time to undercut Amazon’s growth and high margins? Is Blue Nile, the online jewelry retailer, just a fad, or has it established a sufficient reputation such that Zales will never be able to drive it out of business? Is Vistaprint for real, or will it be driven into oblivion once Kinko’s begins printing business cards over the internet? In much the same way, one could question whether the online banking arms of HSBC, Chase and other big banks will over time overwhelm exclusively online banks like Everbank and Bank of Internet. Does the first-mover advantage create a meaningful long-term competitive strength for early online retailers / banks like Blue Nile, Vistaprint or Bank of Internet, or are these online businesses merely experiencing an ephemeral advantage that will dissipate over time? Furthermore, are the barriers to entry for online retailing and online banking so low that current participants are destined for razor-thin margins once the segments mature?
These questions matter because they tell us whether our internet bank will over the long-term achieve 2.0% NIMs vs 1.0% NIMs, or 15% deposit growth vs 5% deposit growth.
My take is that Vistaprint, Blue Nile, and certainly Amazon are here to stay for the next 5-10 years. I suspect the same for Bank of Internet. Intuitively, over the long-term, the winners in online banking should be those who can generate the highest profits despite offering the highest yielding deposits. Specifically, three drivers to watch are (i) who are the lowest-cost providers in terms of non-interest expense, (ii) who generates the most non-interest income, and (iii) who generates the most interest income less loan losses, or, in other words, who is allocating their capital most effectively.
Bank of Internet measures well on the 1st and 3rd drivers, but not so well on the second driver, given that online offerings with brick-and-mortar roots (ie. HSBC Direct or CapitalOne Direct Banking) are better able to sell non-interest income services.
In the end though, it’s important again to separate these theoretical questions from the more practical issue of investing in BOFI. Online banking is still in its early stages. There’s plenty of growth to go around. Bank of Internet is a $75m market cap bank with a smart, innovative management team and a bright near- to intermediate-term future. It has demonstrated an ability to attract deposits by offering high interest rates and to invest those deposits in a manner that generates a commendable return on capital. The management team makes intelligent capital allocation decisions, and because it only has $1.3bn of assets to invest, not $20bn, BOFI can afford a flexible investment strategy that takes advantage of the best investment opportunities at a given time. If you speak with CEO Greg Garrabrants or listen to him on the conference calls, you see quickly that he has a sophisticated, rational outlook on capital allocation. This isn’t a guy who would ever invest in subprime CDOs or 80% LTV mortgages. And he doesn’t oversee a massive operation where lesser minds could be making poor capital allocation decisions without his knowing. BOFI has 57 employees – this isn’t a chaotic black box like Citigroup and there are no investment banking VPs naming SIVs after the neighborhoods they grew up in. BOFI has made amongst the smartest capital allocation decisions of any bank in the country over the past five years. It will likely continue to do so over the next 3-5 years.
As a result, the Bank of Internet should make more money next year, and the year after, and the year after, unless hyperinflation renders all banks insolvent due to poorly matched assets and liabilities. Even if a flat yield curve returns and its net interest margins shrink from 2009 levels, Bank of Internet should still generate sufficient earnings per share to call into question its current valuation. At 0.9x P/TBV and 6.0 P/E, and a small $75m market cap, there’s not much downside to this stock. And there is plenty of upside.
Per usual, this email does not constitute investment advice or a recommendation of any sorts. I may buy, sell or short any of the stocks mentioned at any time. I may be wrong; it won’t be the first or last time.
LEGAL:
THIS COMMUNICATION IS FOR INFORMATIONAL AND EDUCATIONAL PURPOSES ONLY AND SHALL NOT BE CONSTRUED TO CONSTITUTE INVESTMENT ADVICE. NOTHING CONTAINED HEREIN SHALL CONSTITUTE A SOLICITATION, RECOMMENDATION OR ENDORSEMENT TO BUY OR SELL ANY SECURITY OR OTHER FINANCIAL INSTRUMENT OR TO BUY ANY INTERESTS IN ANY INVESTMENT FUNDS OR OTHER ACCOUNTS. THE AUTHOR HAS NO OBLIGATION TO UPDATE THE INFORMATION CONTAINED HEREIN AND MAY MAKE INVESTMENT DECISIONS THAT ARE INCONSISTENT WITH THE VIEWS EXPRESSED IN THIS COMMUNICATION. THE AUTHOR MAKES NO REPRESENTATIONS OR WARRANTIES AS TO THE ACCURACY, COMPLETENESS OR TIMELINESS OF THE INFORMATION, TEXT, GRAPHICS OR OTHER ITEMS CONTAINED IN THIS COMMUNICATION. KERRISDALE CAPITAL MANAGEMENT, LLC OR AFFILIATED ENTITIES MAY OWN OR OTHERWISE HAVE AN INVESTMENT RELATED TO ANY COMPANIES MENTIONED IN THIS COMMUNICATION. THE SENDER EXPRESSLY DISCLAIMS ALL LIABILITY FOR ERRORS OR OMISSIONS IN, OR THE MISUSE OR MISINTERPRETATION OF, ANY INFORMATION CONTAINED IN THIS COMMUNICATION.
